Web UI
The Web UI is the place to observe and steer Elowen without interrupting the work. It is a Next.js client over the same daemon used by the terminal and chat-platform plugins: it does not have a second task store, conversation engine, or permission model.
Desktop navigation uses one shared spatial rail. Account and Settings use a focused section surface; operational pages use wide workspaces with dense lists, filters, and an in-context detail drawer. On smaller screens the same information becomes a linear layout with drawers rather than a compressed desktop composition.
The shell
Every page sits inside the same shell, so navigation and global controls never move.
- Orbital navigation rail — the left rail arranges modules as nodes; the active node grows to mark where you are. Collapse the rail when you want the workspace full-width.
- Command palette — press
Ctrl+K(or the search button in the top bar) to run quick actions: create a new task or mission, or jump to any module, even ones outside the compact primary navigation. - Notification bell — the top bar bell collects agents waiting on you and escalations. Items with a decision offer inline Allow / Reject buttons right in the dropdown, so most approvals never need a page change.
- Advisor dock — the floating button opens the brain chat dock from anywhere. A dot on the button means an agent is running for you right now.
- Language and account — the top bar carries the language switcher and your account avatar, which opens account settings.
Dashboard
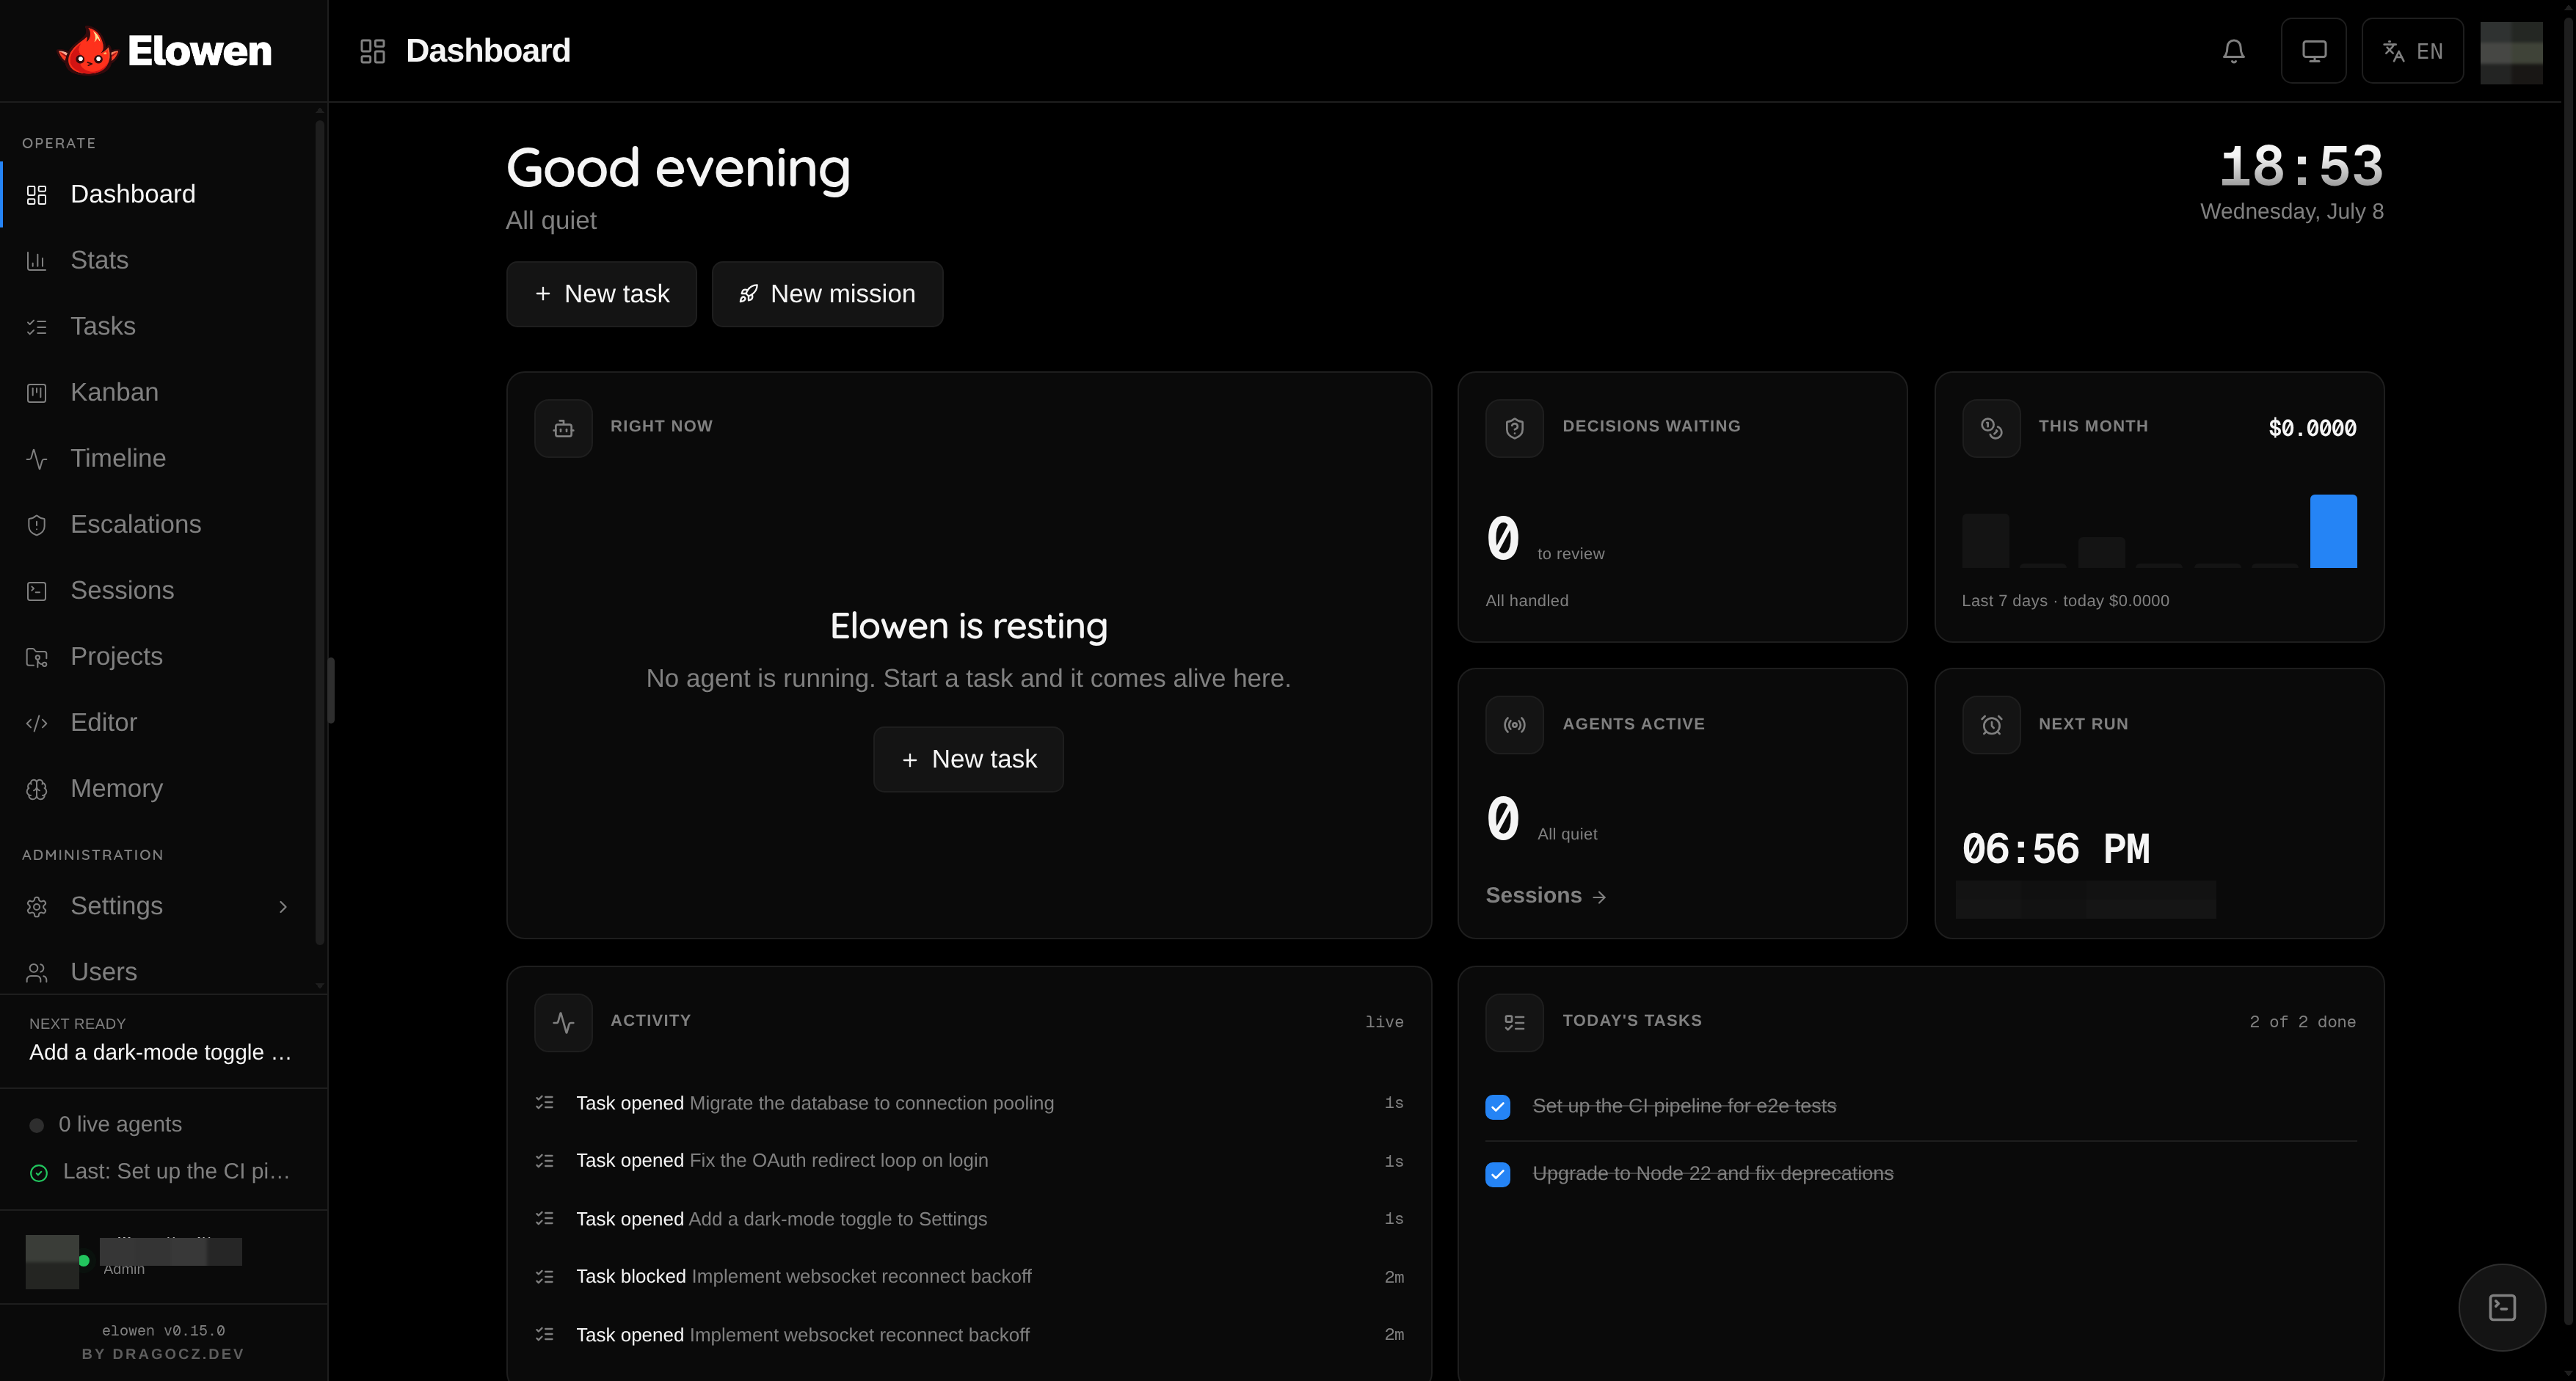
/dash is the landing view: a quick read on what Elowen is doing and what needs you.
- Hero — a time-of-day greeting with a live clock, the agent presence state (resting, working, or waiting on you), and an animated mascot that reacts to that state.
- Quick composer — a prompt field on the dashboard. Type and press Enter to open the brain dock with your text already in the composer.
- Activity tile — a live journal of daemon events as they happen.
- Today's tasks tile — running tasks marked with a now pill, plus what is scheduled and what finished today.
- Banners — pending decisions and unfinished setup appear as banners at the top, so nothing blocks silently.
Workspaces
| Route | Use it for |
|---|---|
/dash | A quick view of current agent activity and important signals. |
/chat | A full-page conversation with the brain, with a distraction-free fullscreen option. |
/tasks | Creating, filtering, scheduling, and steering task work and missions. |
/kanban | Seeing task state as a board and organizing work visually. |
/sessions | Watching live worker sessions and opening a terminal when appropriate. |
/timeline | Reviewing activity and related commit history. |
/stats | Generation speed, cache hit rate, token split, and cost trends. |
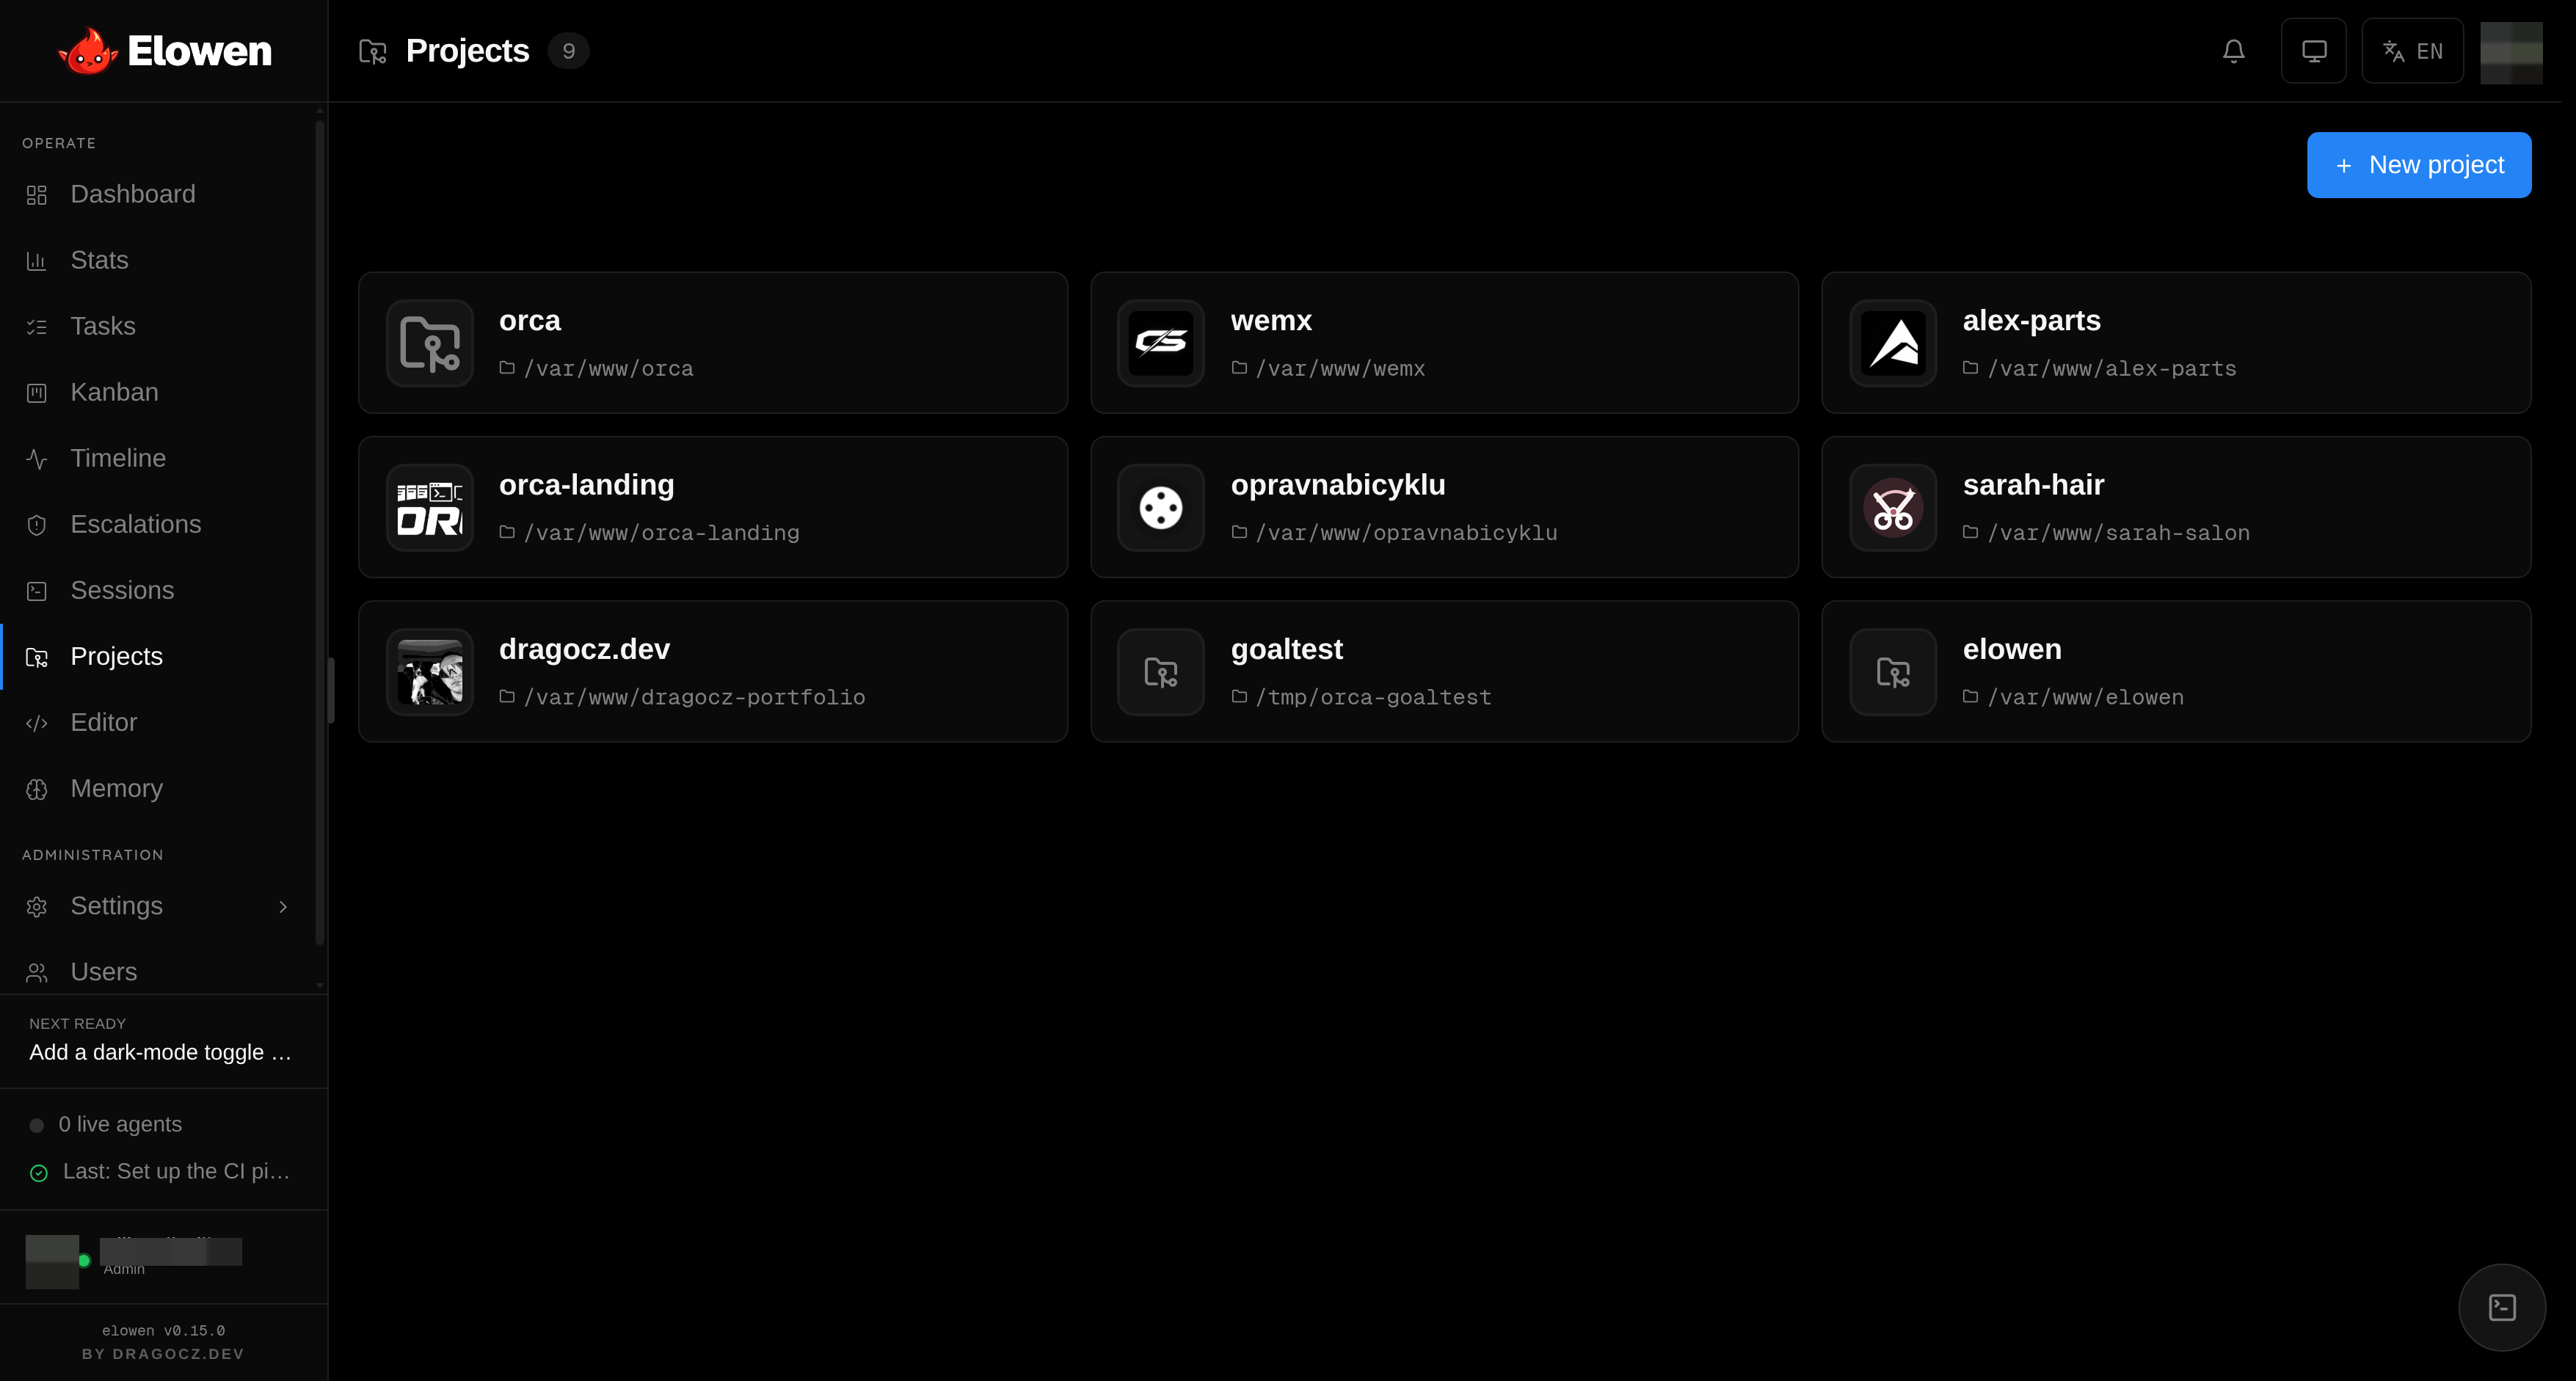
/projects | Managing the repositories Elowen may work in. |
/editor | Browsing and editing project files in the built-in editor. |
/memory | Curating durable memories and their categories. |
/settings | Configuring the instance, models, tools, and automation. |
/users | Managing users, project scope, and per-user tool access. |
Tasks, Kanban, and Sessions
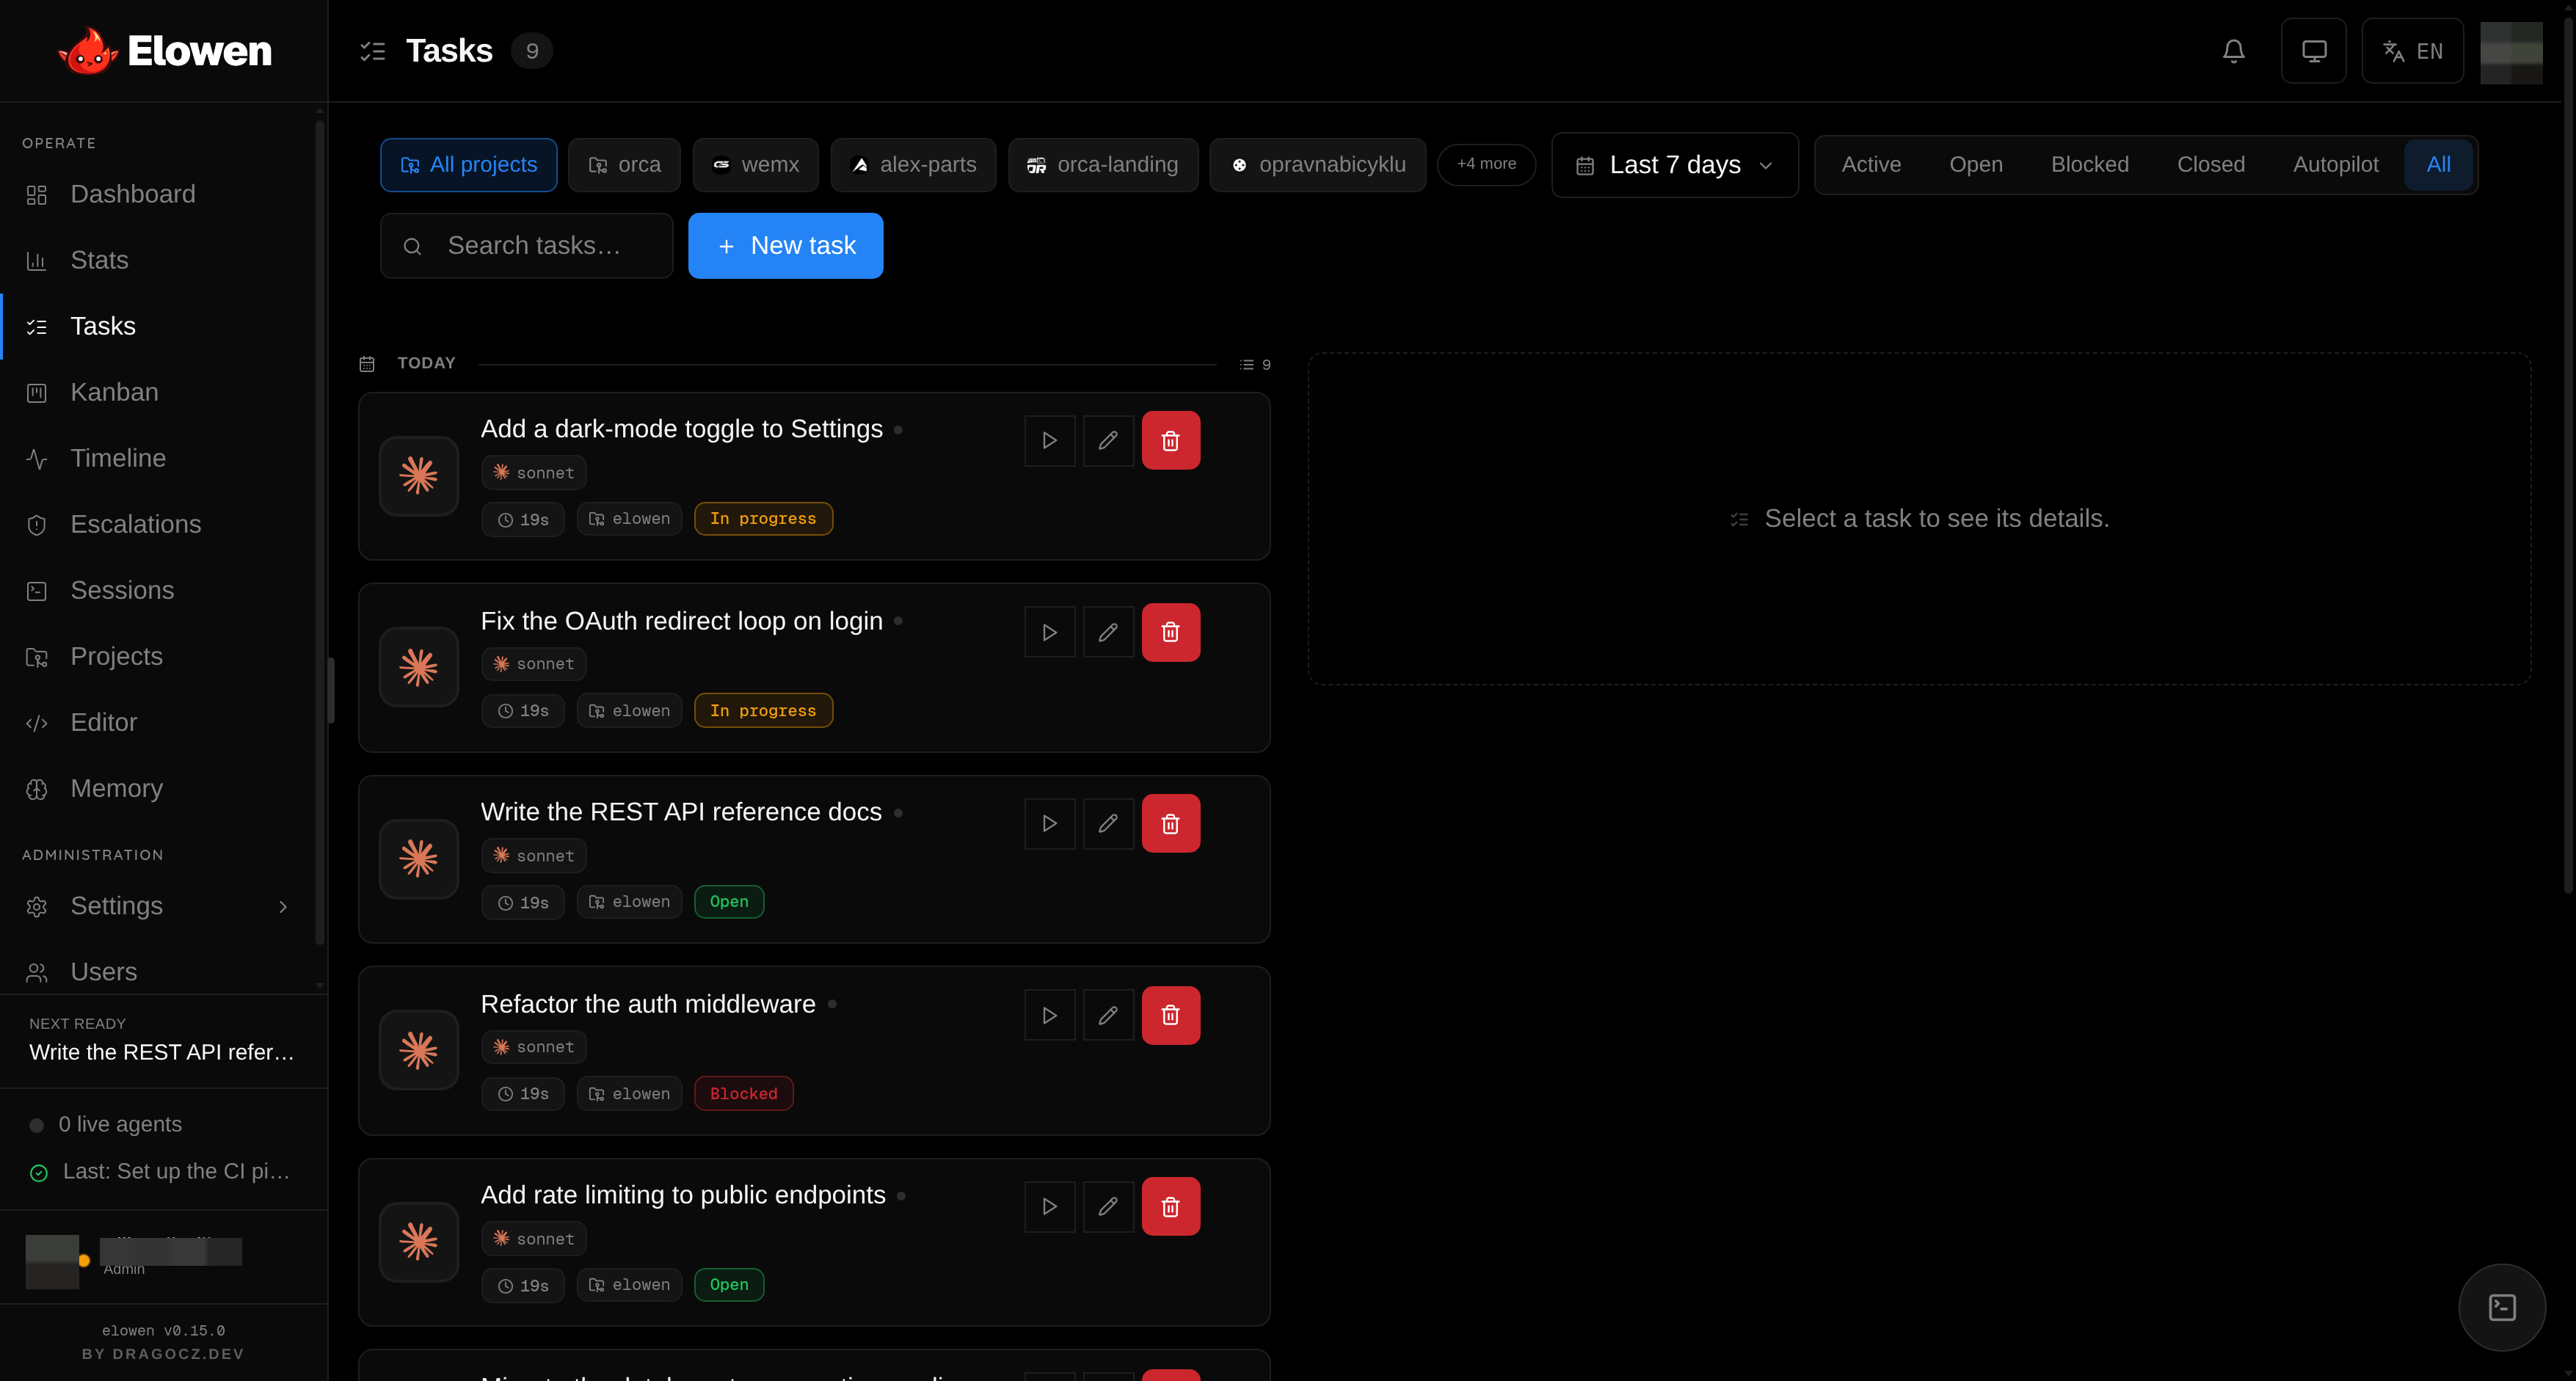
The Tasks workspace is the primary operational surface. Its header exposes the important action, summary, search, and filters; the main area stays wide enough for a useful list. Selecting a task opens a right-side detail drawer so you can inspect output, changes, usage, dependencies, or mission state without losing the filtered list behind it.
- Filters — narrow the list by status, free-text search, date range, and project. Bulk actions apply to the selection, and pagination keeps long lists fast.
- Detail pane — shows a live tail of the task's output, its dependencies, and a result summary. Actions include start, stop, interrupt, approve, re-run, open terminal, and copy id. Missions render their flow as a visualization inside the same pane.
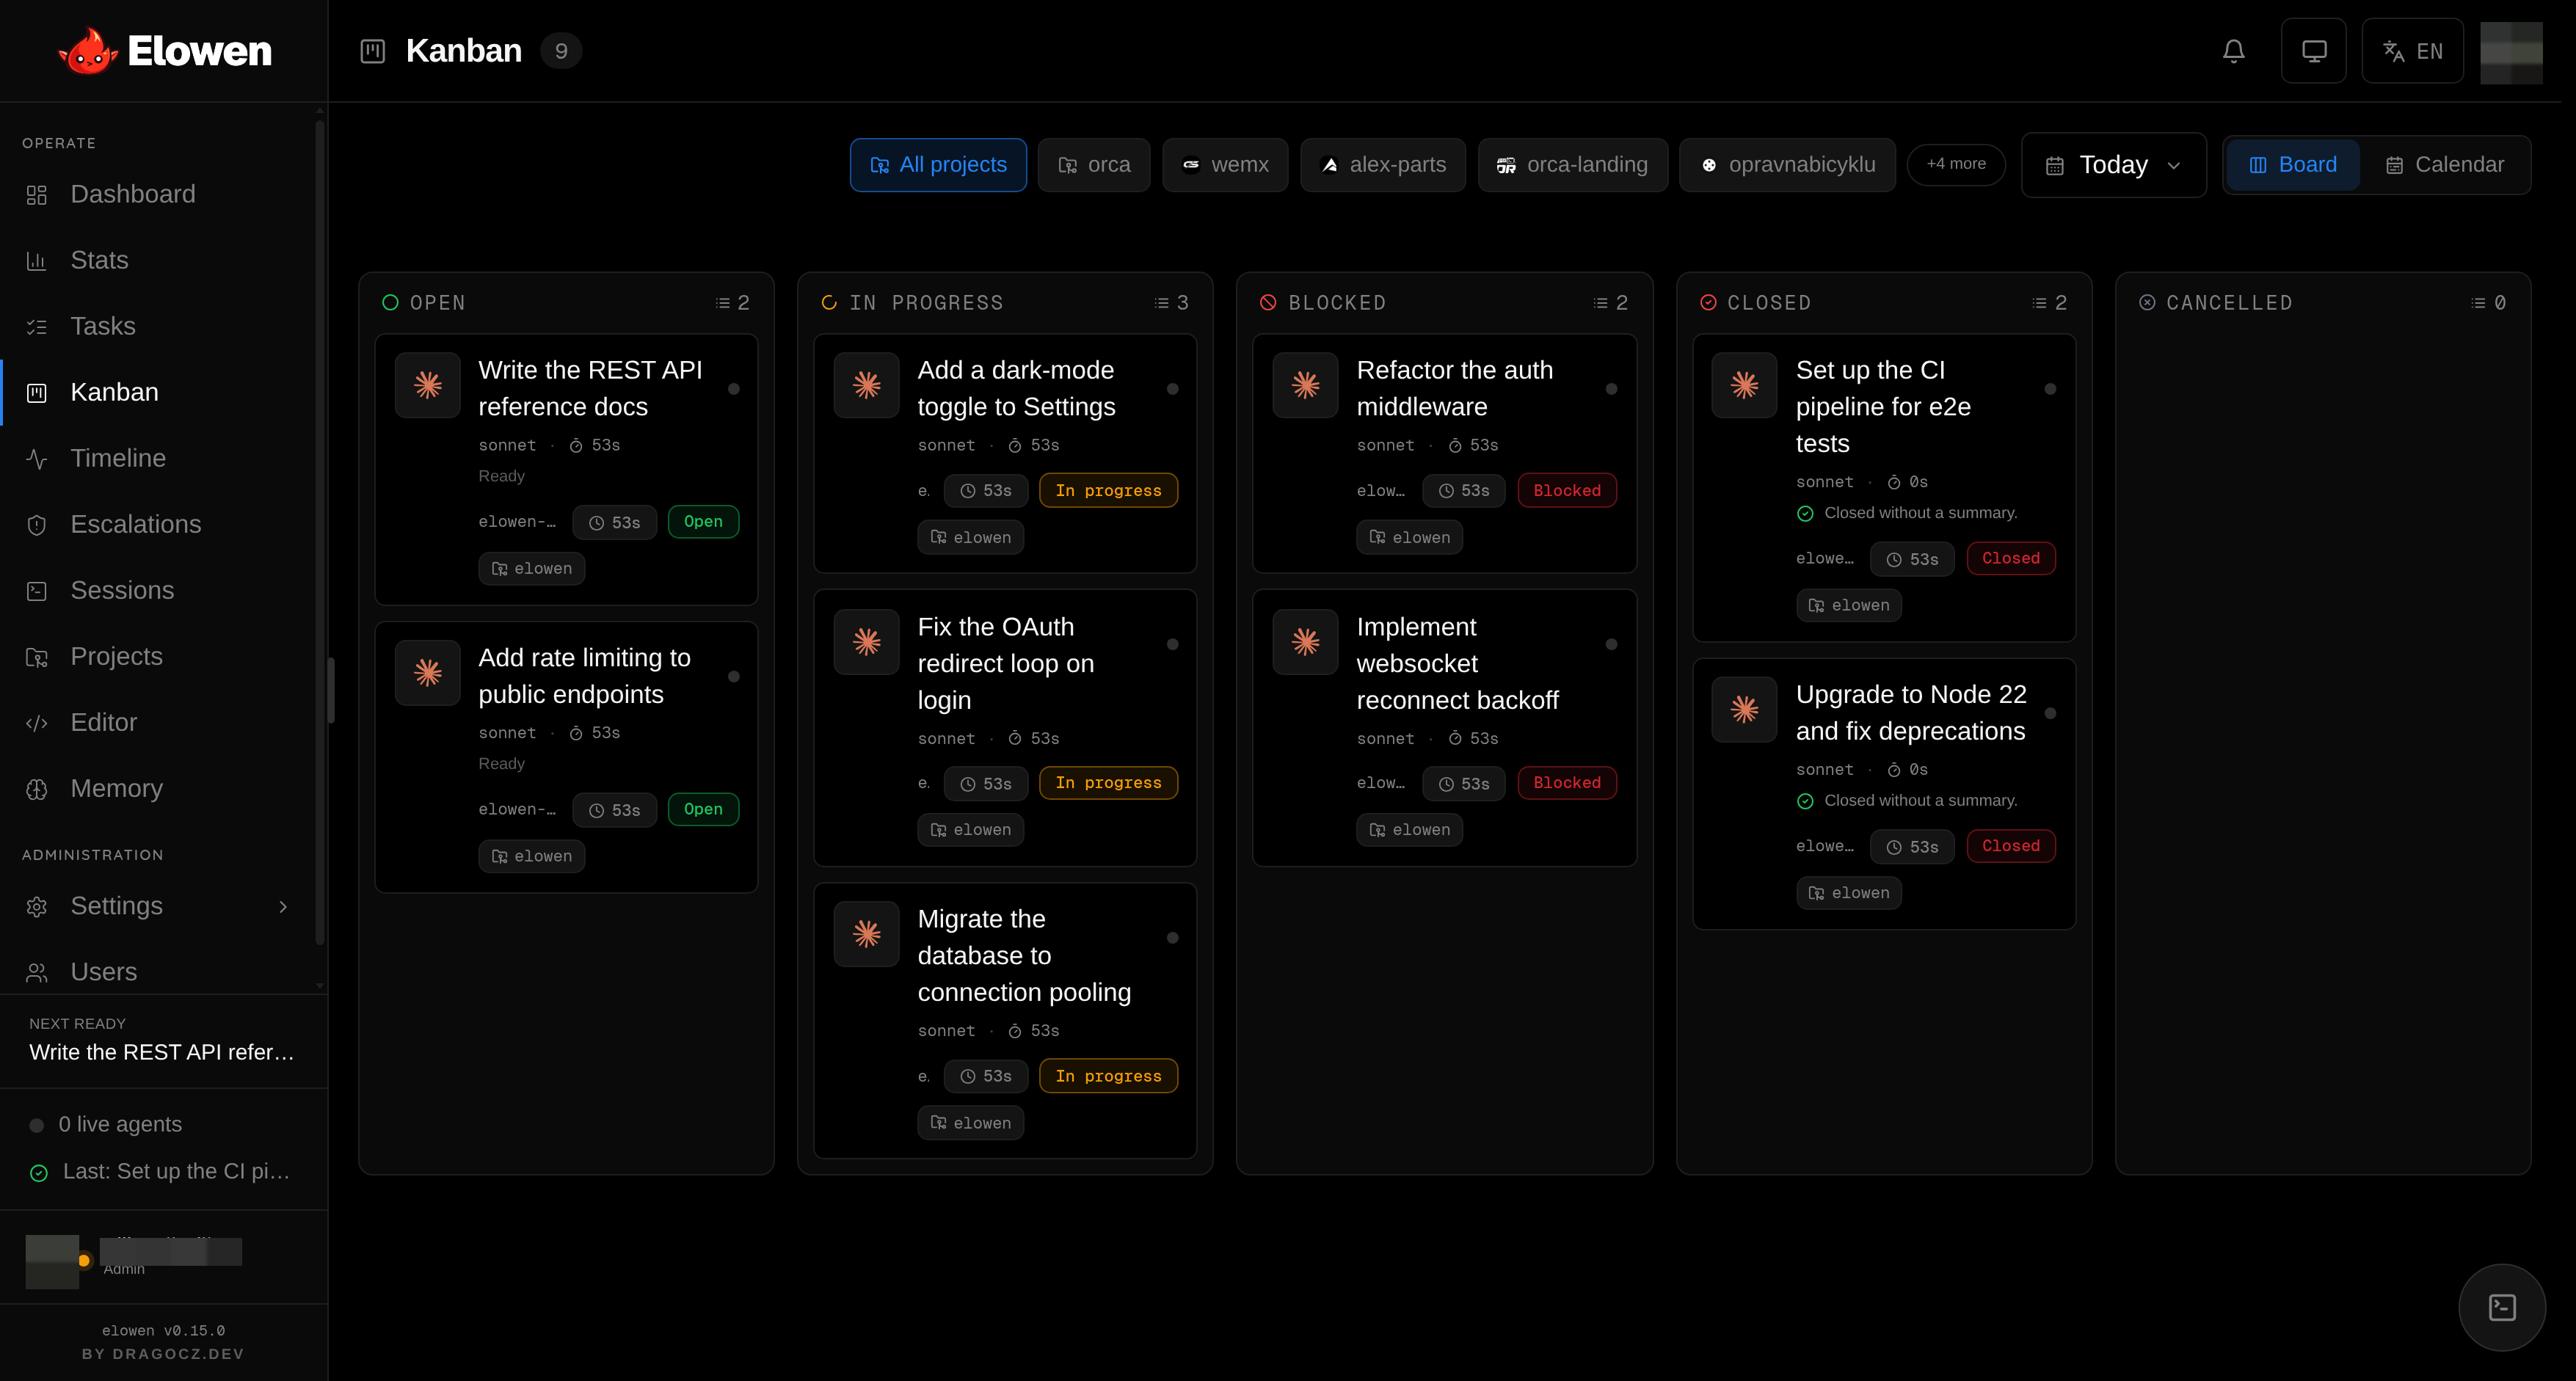
Kanban presents the same task state as five columns you can drag cards between. Dropping a card onto another card sets a dependency between them. Autopilot missions appear as epic cards whose phases collapse and expand. A calendar view shows the same work laid out over time.
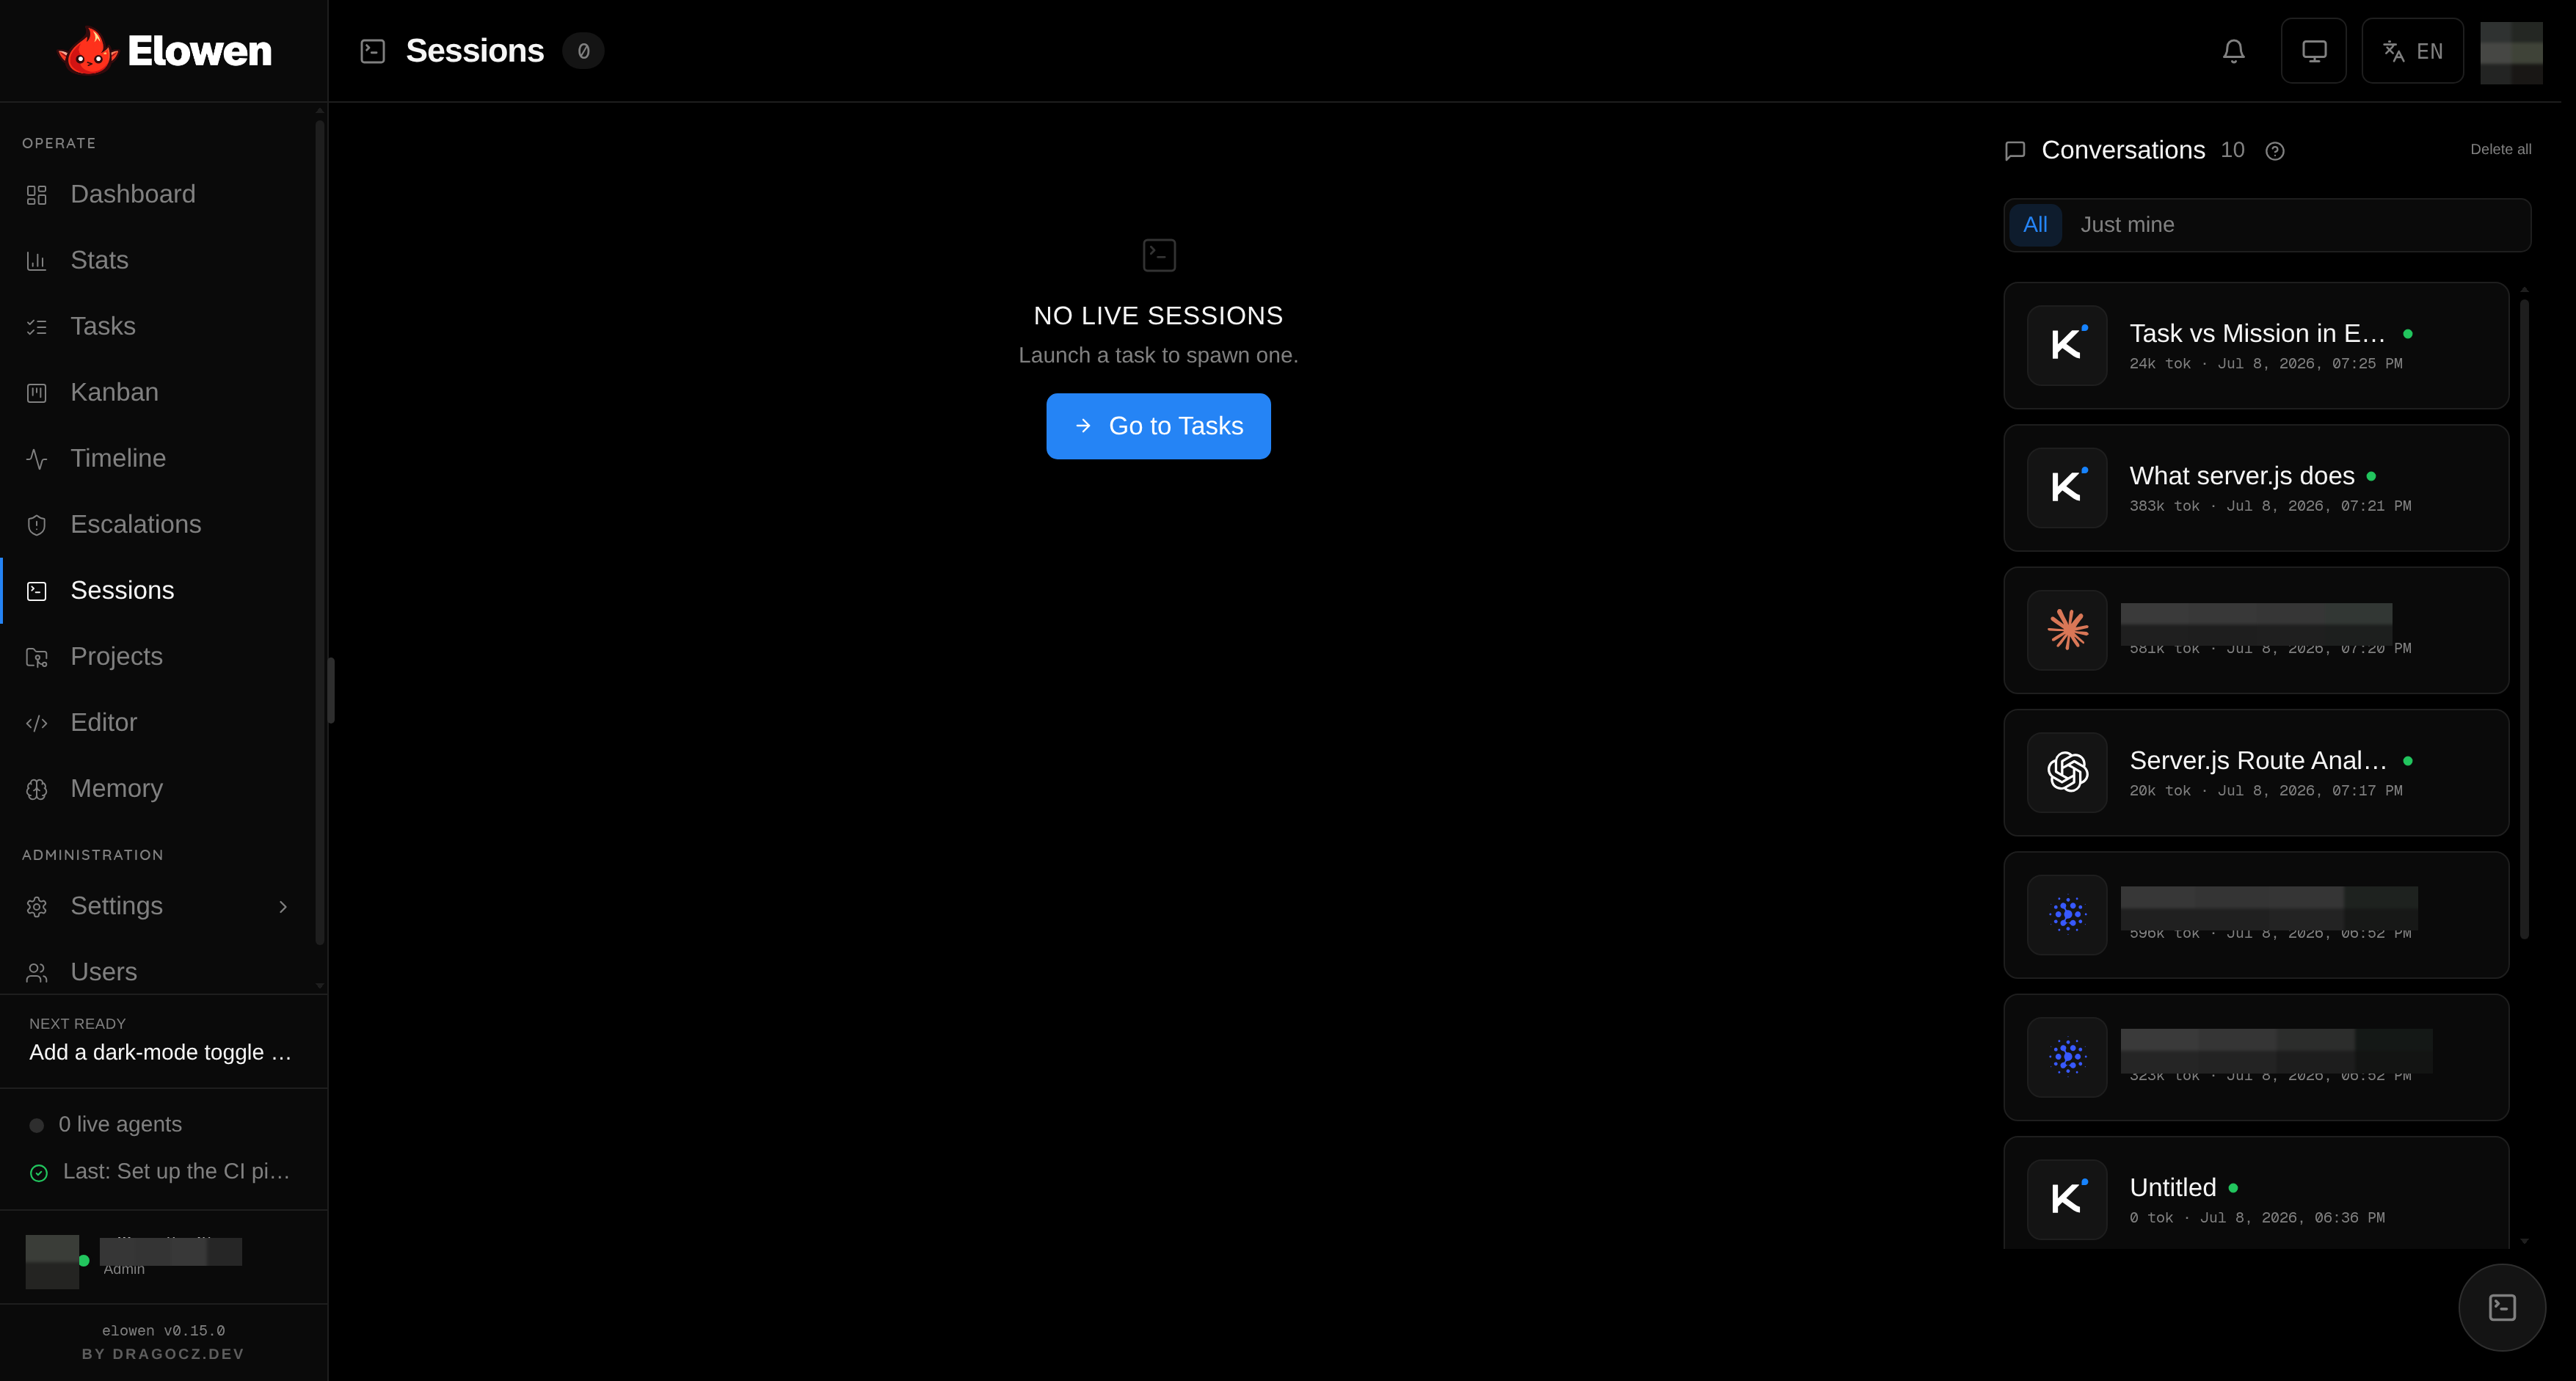
Sessions shows live tmux-backed workers as cards, each with a live rolling tail of output. Header metrics count what is live, what needs input, and how many workers are running. A session waiting on a decision shows inline Allow / Reject — with individual choices when the agent asked a multiple-choice question — alongside interrupt, kill, and open-terminal actions.
Its second tab keeps the brain conversation history from every surface — web, CLI, channels, and task agents — in one place. Administrators can optionally enable Automatic conversation cleanup there: the hourly janitor removes only a user's old, inactive top-level conversations. It never removes running, active, channel, task, delegated-child, or child-bearing conversations.
Timeline, Escalations, and Stats
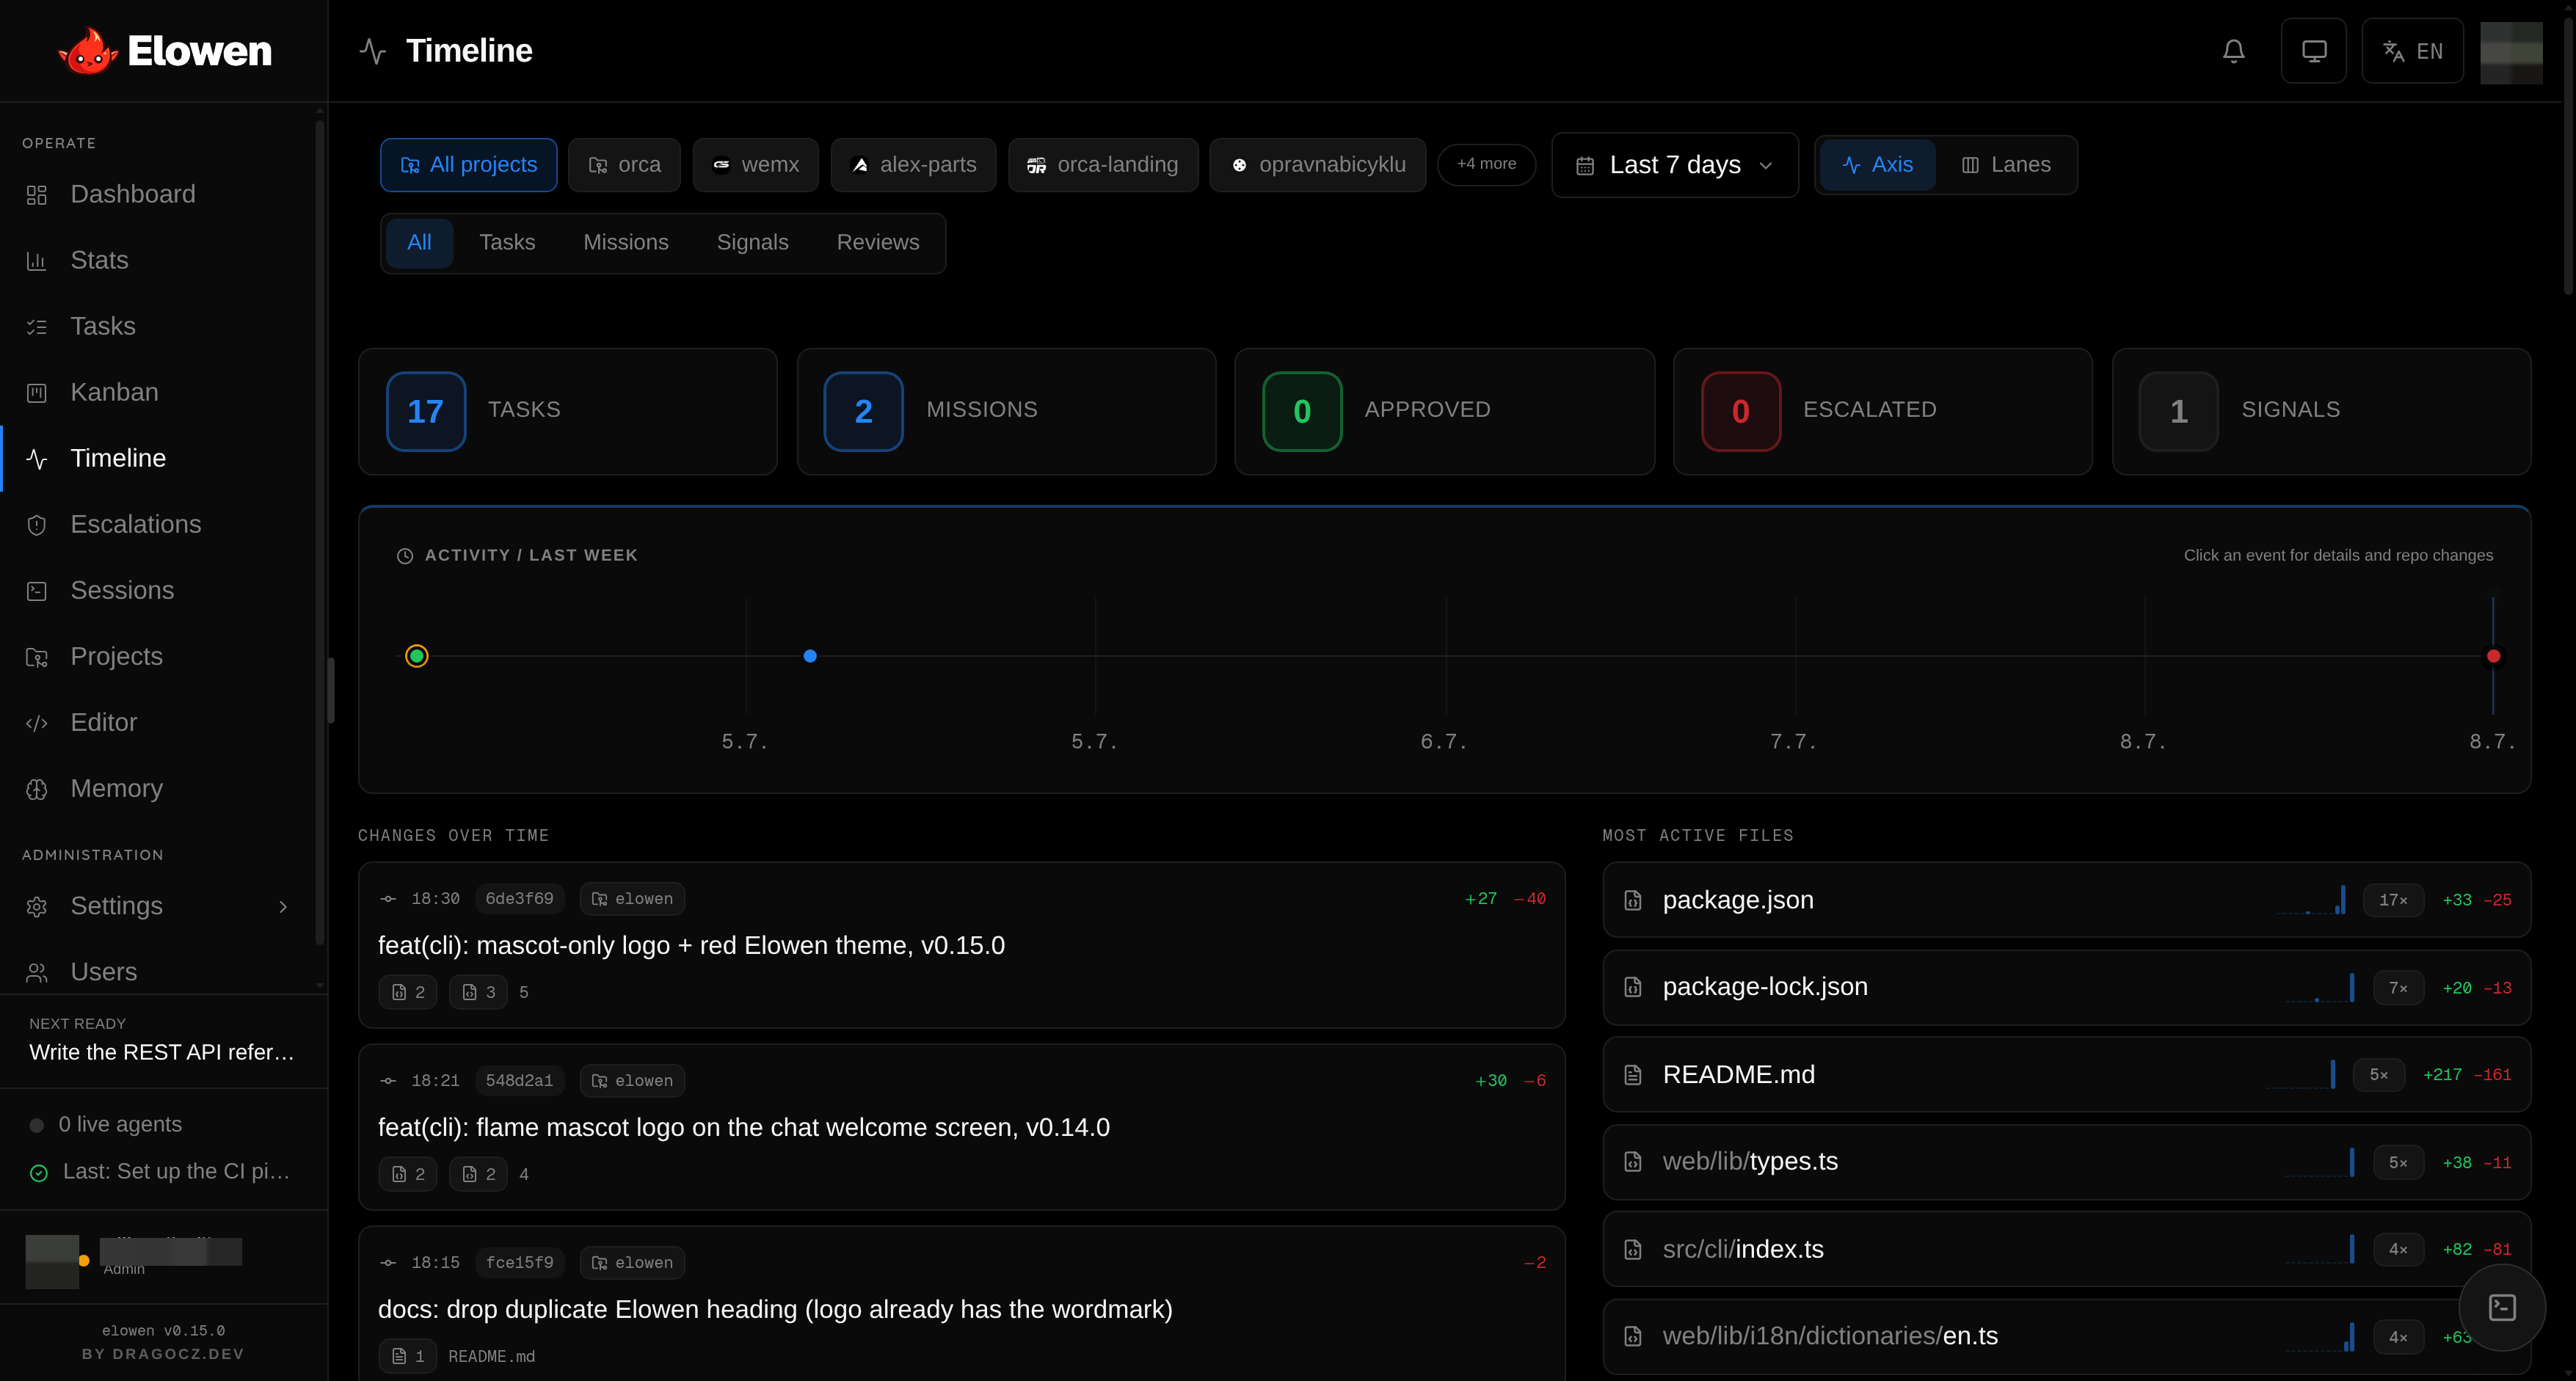
Timeline shows activity two ways: an axis view and a swimlane view. Drilling into an event shows the project diff behind it, and the changes-over-time view summarizes commits inside a window, filterable by type, project, and range.
Escalations has two inboxes. Pending asks are questions from agents that you reply to inline. Review escalations carry the overseer's reasoning, and you either approve & continue or send the work back for a re-run.
Stats breaks cost down by model in a table: tokens, cache, tokens/s, price, and a share bar per model, with a date-range filter. Generation speed (tokens/s per model with an average in the hero), cache hit rate, and the input/output token split sit alongside. A provider-reported cost is authoritative; a ~ amount is an estimate from the models.dev catalog, used for proxy or custom-model turns when the provider does not report a price. Administrators can reset usage accounting from here. The /stats slash command opens the same data as a modal (web) or an overlay with ⇄-switchable sections (CLI).
Chat
The chat dock is available across the product, and /chat expands the same conversation into a full-page view that can go fullscreen; both lay out responsively on small screens. Either surface opens the same server-side brain conversation as the terminal, including streaming activity, tool traces, model selection, queued messages, and permission questions. The transcript mirrors the CLI: tool calls are grouped into collapsible runs, a completed tool's output appears live, and session changes (a model or mode switch) and workflow runs render as inline markers.
- Composer — typing
/opens the slash command menu; see Slash Commands. Attach files with the paperclip button or by pasting. - Model picker — switch models mid-conversation; the next message uses the new model without reconnecting.
- Queued messages — messages sent while the agent is busy queue up; press ↑ to recall and edit the last one.
- History rail — search past conversations, rename, export, delete, or start a new chat.
- Agents table — live sub-agents of the conversation, with drill-in to each one's work.
- Process panel — background shell processes the agent started, with live output.
- Stats modal — tokens, context usage, and cost for the current conversation.
Long conversations load lazily — opening one fetches the most recent messages and older ones load as you scroll up, with your reading position preserved; streaming never yanks you back to the newest message. See Brain & Chat for conversation behavior.
Telemetry rail
/chat carries the same live telemetry rail as the CLI: a quiet companion column beside the transcript rather than a dashboard that asks for attention. An owl mascot tops it and mirrors the agent — breathing while a turn runs, settling when it does not — so the rail reads as inhabited. Sections appear only when they have something to report; an idle rail stays nearly empty.
| Section | Shows |
|---|---|
| Context | A fill meter for the context window, plus tokens used and running cost. |
| Goal | The active goal, its turn budget, and subgoal tally. |
| Limits | Subscription usage windows and plan type. |
| Workflows | Running workflows; click one to open its graph. |
| Agents | Live sub-agents, with a drill-in to each one's work. |
| Processes | Background shell processes, each opening a live output modal. |
| Project | The working directory and current branch. |
| MCP / LSP | Connected MCP servers and whether the language server is active. |
Drag the rail's inner edge to widen it (your width is remembered per device), and use the header button to hide or show it. On a phone the rail becomes a right-hand drawer opened from the same button, so it never squeezes the conversation.
The owl is also a door: clicking it opens an orbital command field — a ring of the slash commands worth reaching for mid-conversation, such as plan, build, workflow, compact, rename, new, and model. It is a second door onto the composer's / menu, not a separate implementation; see Slash Commands.
The command field opens as an overlay, not inside the rail — an orbit needs more width than even the widest rail provides.
Work modes
The web chat supports the same plan, build, and workflow modes as the CLI. Switch with the /plan, /build, and /workflow commands or from the owl's command field. Build is the default every conversation starts in, so the header shows a mode pill only while you are in plan or workflow mode — a mode that changes what the agent may do is never a hidden switch.
- Rename —
/renameopens a dialog with the conversation title prefilled; commit with Enter. - Leaving plan mode — when the agent submits a plan, a decision bar appears under the turn. Approve it to implement the plan, which returns you to build mode, or send another message to keep refining.
Workflow graph
A running workflow listed in the telemetry rail opens as a visual graph. Waves become columns and dependencies become curves; each node carries its status by both glyph and border, so state never rests on colour alone.
| Status | Glyph |
|---|---|
| Pending | ○ |
| Running | ● |
| Done | ✓ |
| Error | ✗ |
Select a node to see its vitals in a dock under the graph — status, model, tokens, elapsed time, dependencies, and its result or error. Arrow keys move the selection between nodes. The graph reads the live snapshot, so an open view tracks the workflow as its nodes run. On a phone the same data renders as a wave-grouped list, because a hand-sized web of boxes is unreadable.
Reasoning output
A brain icon in the chat header toggles whether the model's reasoning (thinking) appears in the transcript. Each reasoning block is collapsible, shows how long the model thought, stays open while it streams, and folds itself away once the turn settles.
The toggle is a display switch only. The daemon keeps streaming reasoning either way, so hidden thoughts remain in the transcript and reappear the moment you turn the switch back on. Your choice is remembered per device.
Projects and editor
Projects define the repositories Elowen may work in. From a project you can review Git state, commits, changed files, and related work. Opening a commit or file from a table keeps it in a bounded modal or drawer so the original workspace remains visible.
The built-in editor is a full code editor for inspecting or making a focused change yourself:
- File tree — with a context menu: new, rename, duplicate, delete, copy path.
- Editing — Monaco with tabs;
Ctrl+Ssaves. - Diff and preview — diff the current file against HEAD, preview Markdown and images, and review full commit diffs.
- Layout — fullscreen mode and a resizable panel height.
Read Projects & Workflow before enabling PR automation or assigning projects to other users.
Memory
The Memory workspace is where you inspect, search, categorize, merge, restore, or purge durable facts. It is intentionally a workspace, not a hidden prompt cache: the list and selected-memory drawer keep the current selection and surrounding results visible together. See Memory & Embeddings for how memory works and how it is configured.
Settings and account
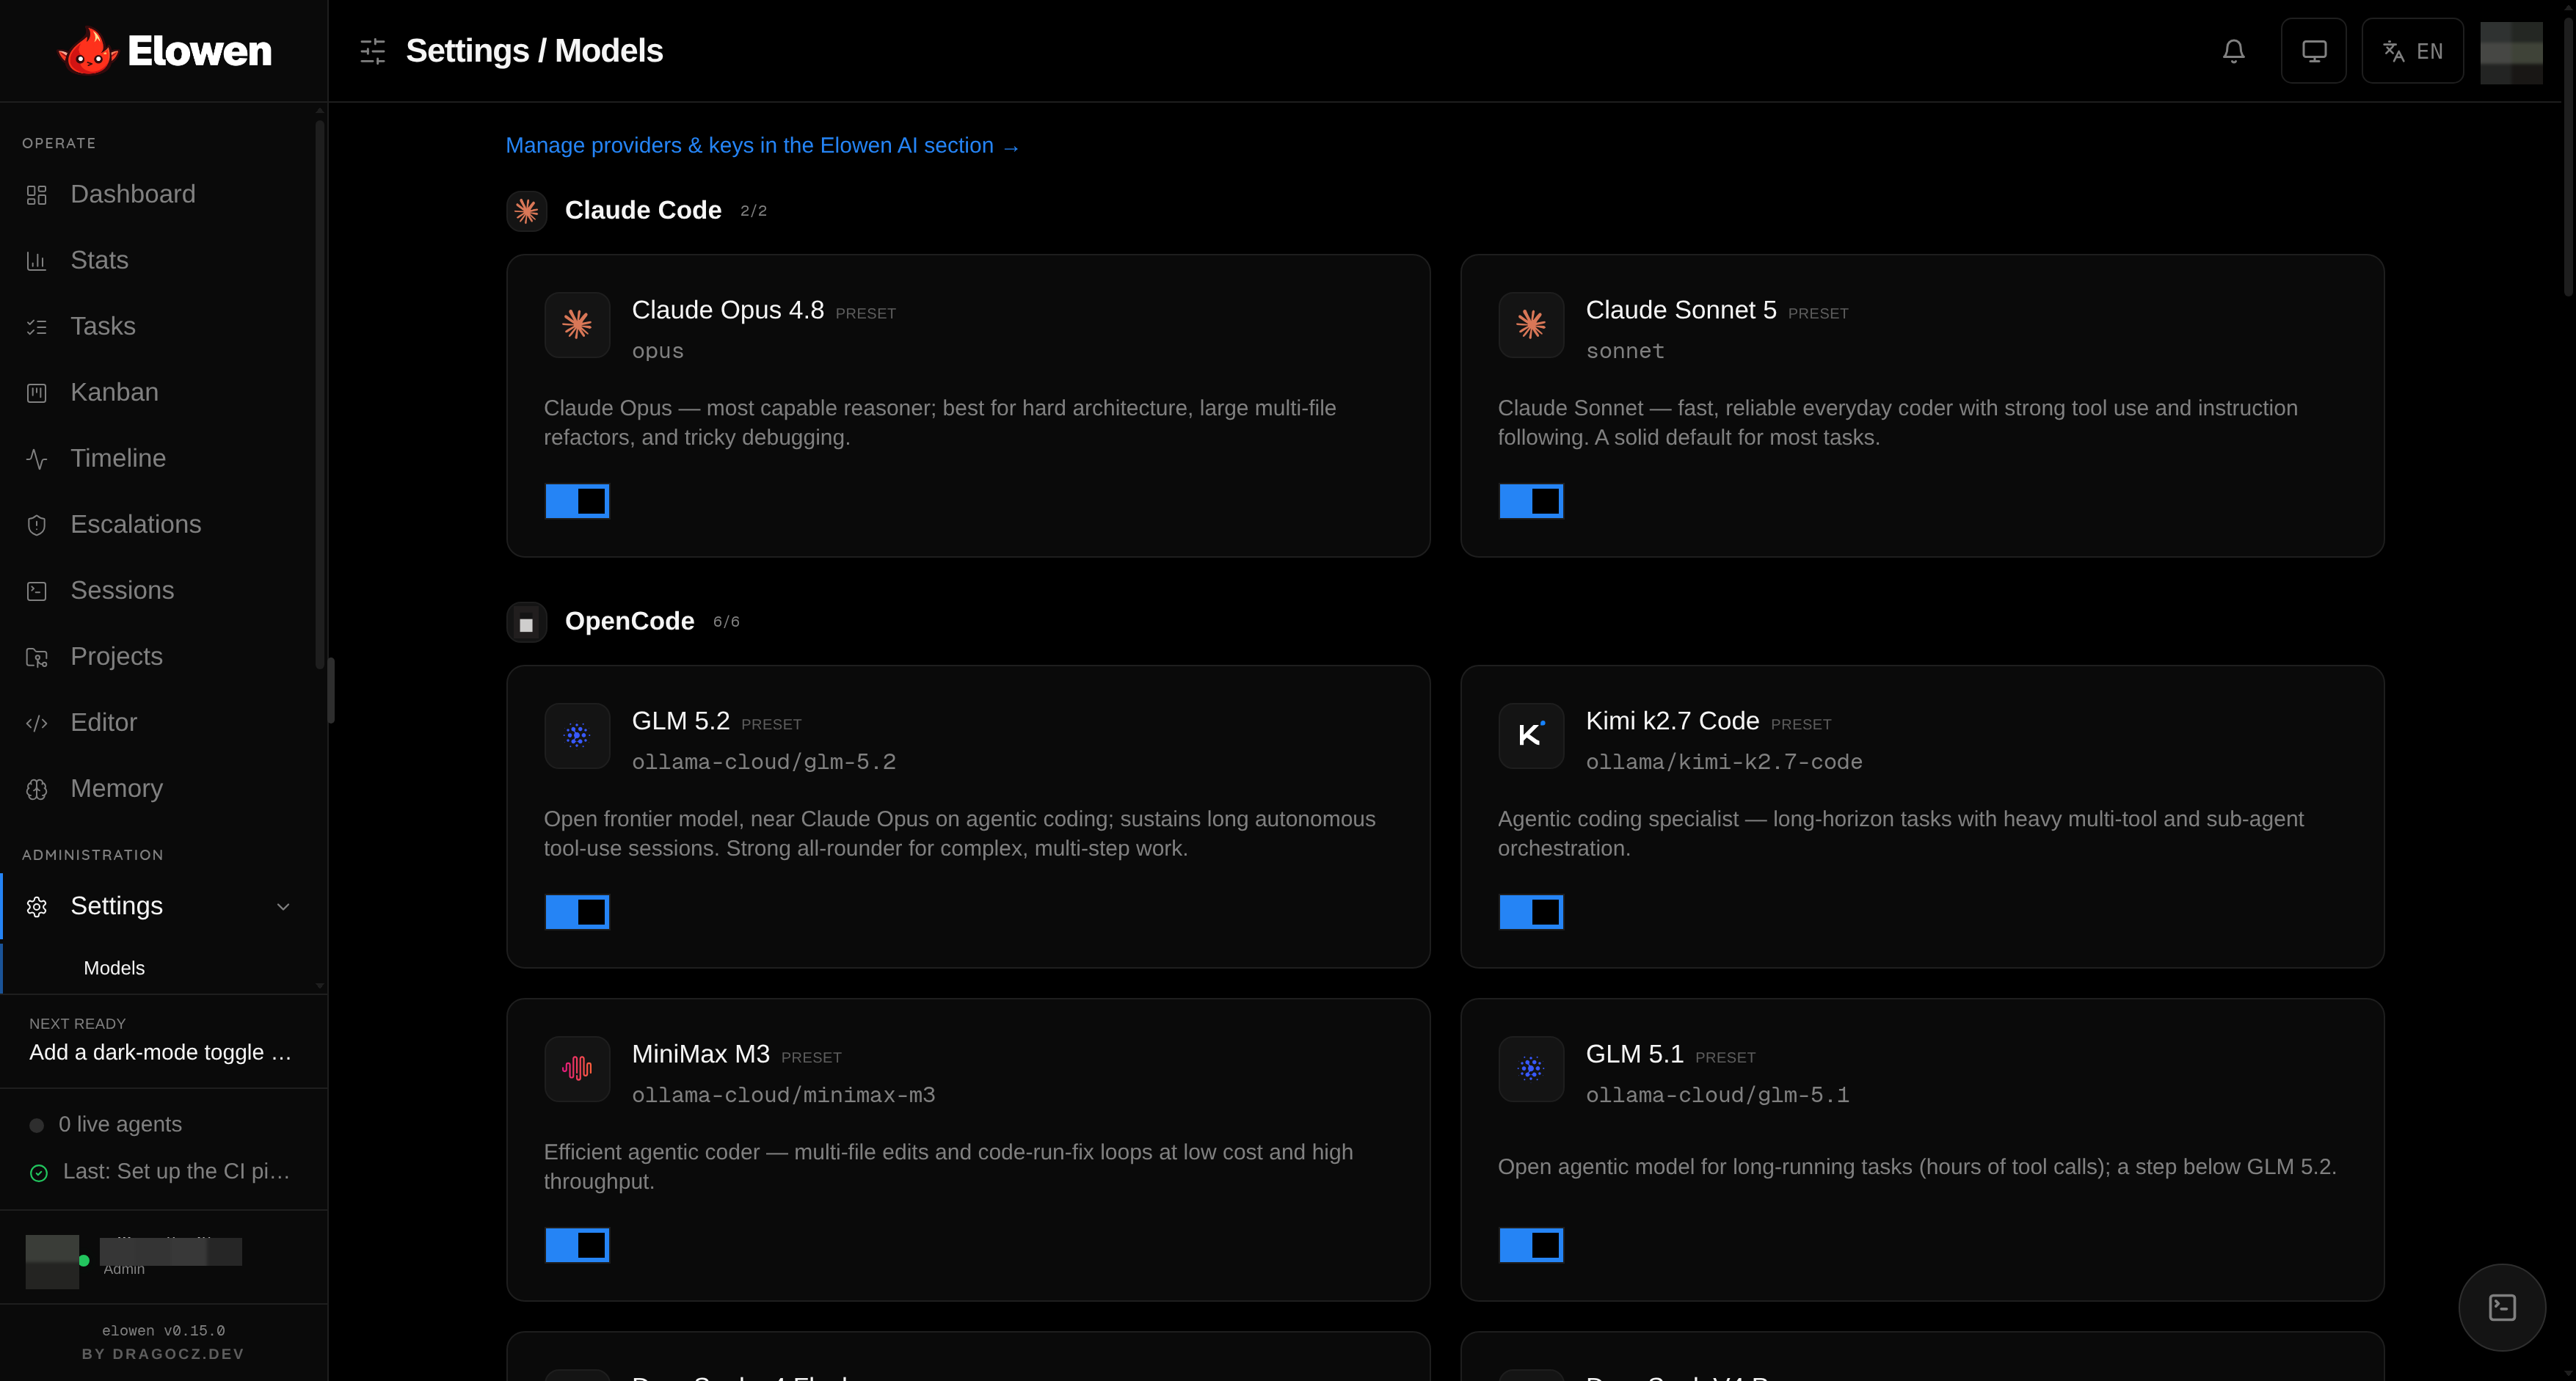
Settings has one ordered set of sections:
- System — readiness, service state, updates, and token lifetime.
- Elowen AI — provider accounts, agent identity, limits, and context windows.
- Models — available executor models and their notes.
- CLI Agents — installed coding-agent executors and their launch behavior.
- Data — operational data maintenance.
- GitHub — PR workflow defaults and repository integration status.
- Autopilot — mission defaults, planning, review, and TDD behavior.
- Plugins — installed capabilities, their settings, marketplace, and runtime details.
- Memory — embedding and categorization configuration.
Account settings are personal: profile, security, notifications, communication preferences, memory and terminal preferences, and the user's Elowen AI choices. Routine settings save as you change them; high-impact actions such as OAuth connections, permission changes, deletion, and unattended modes retain explicit confirmation. See Account & Preferences.
Users and access
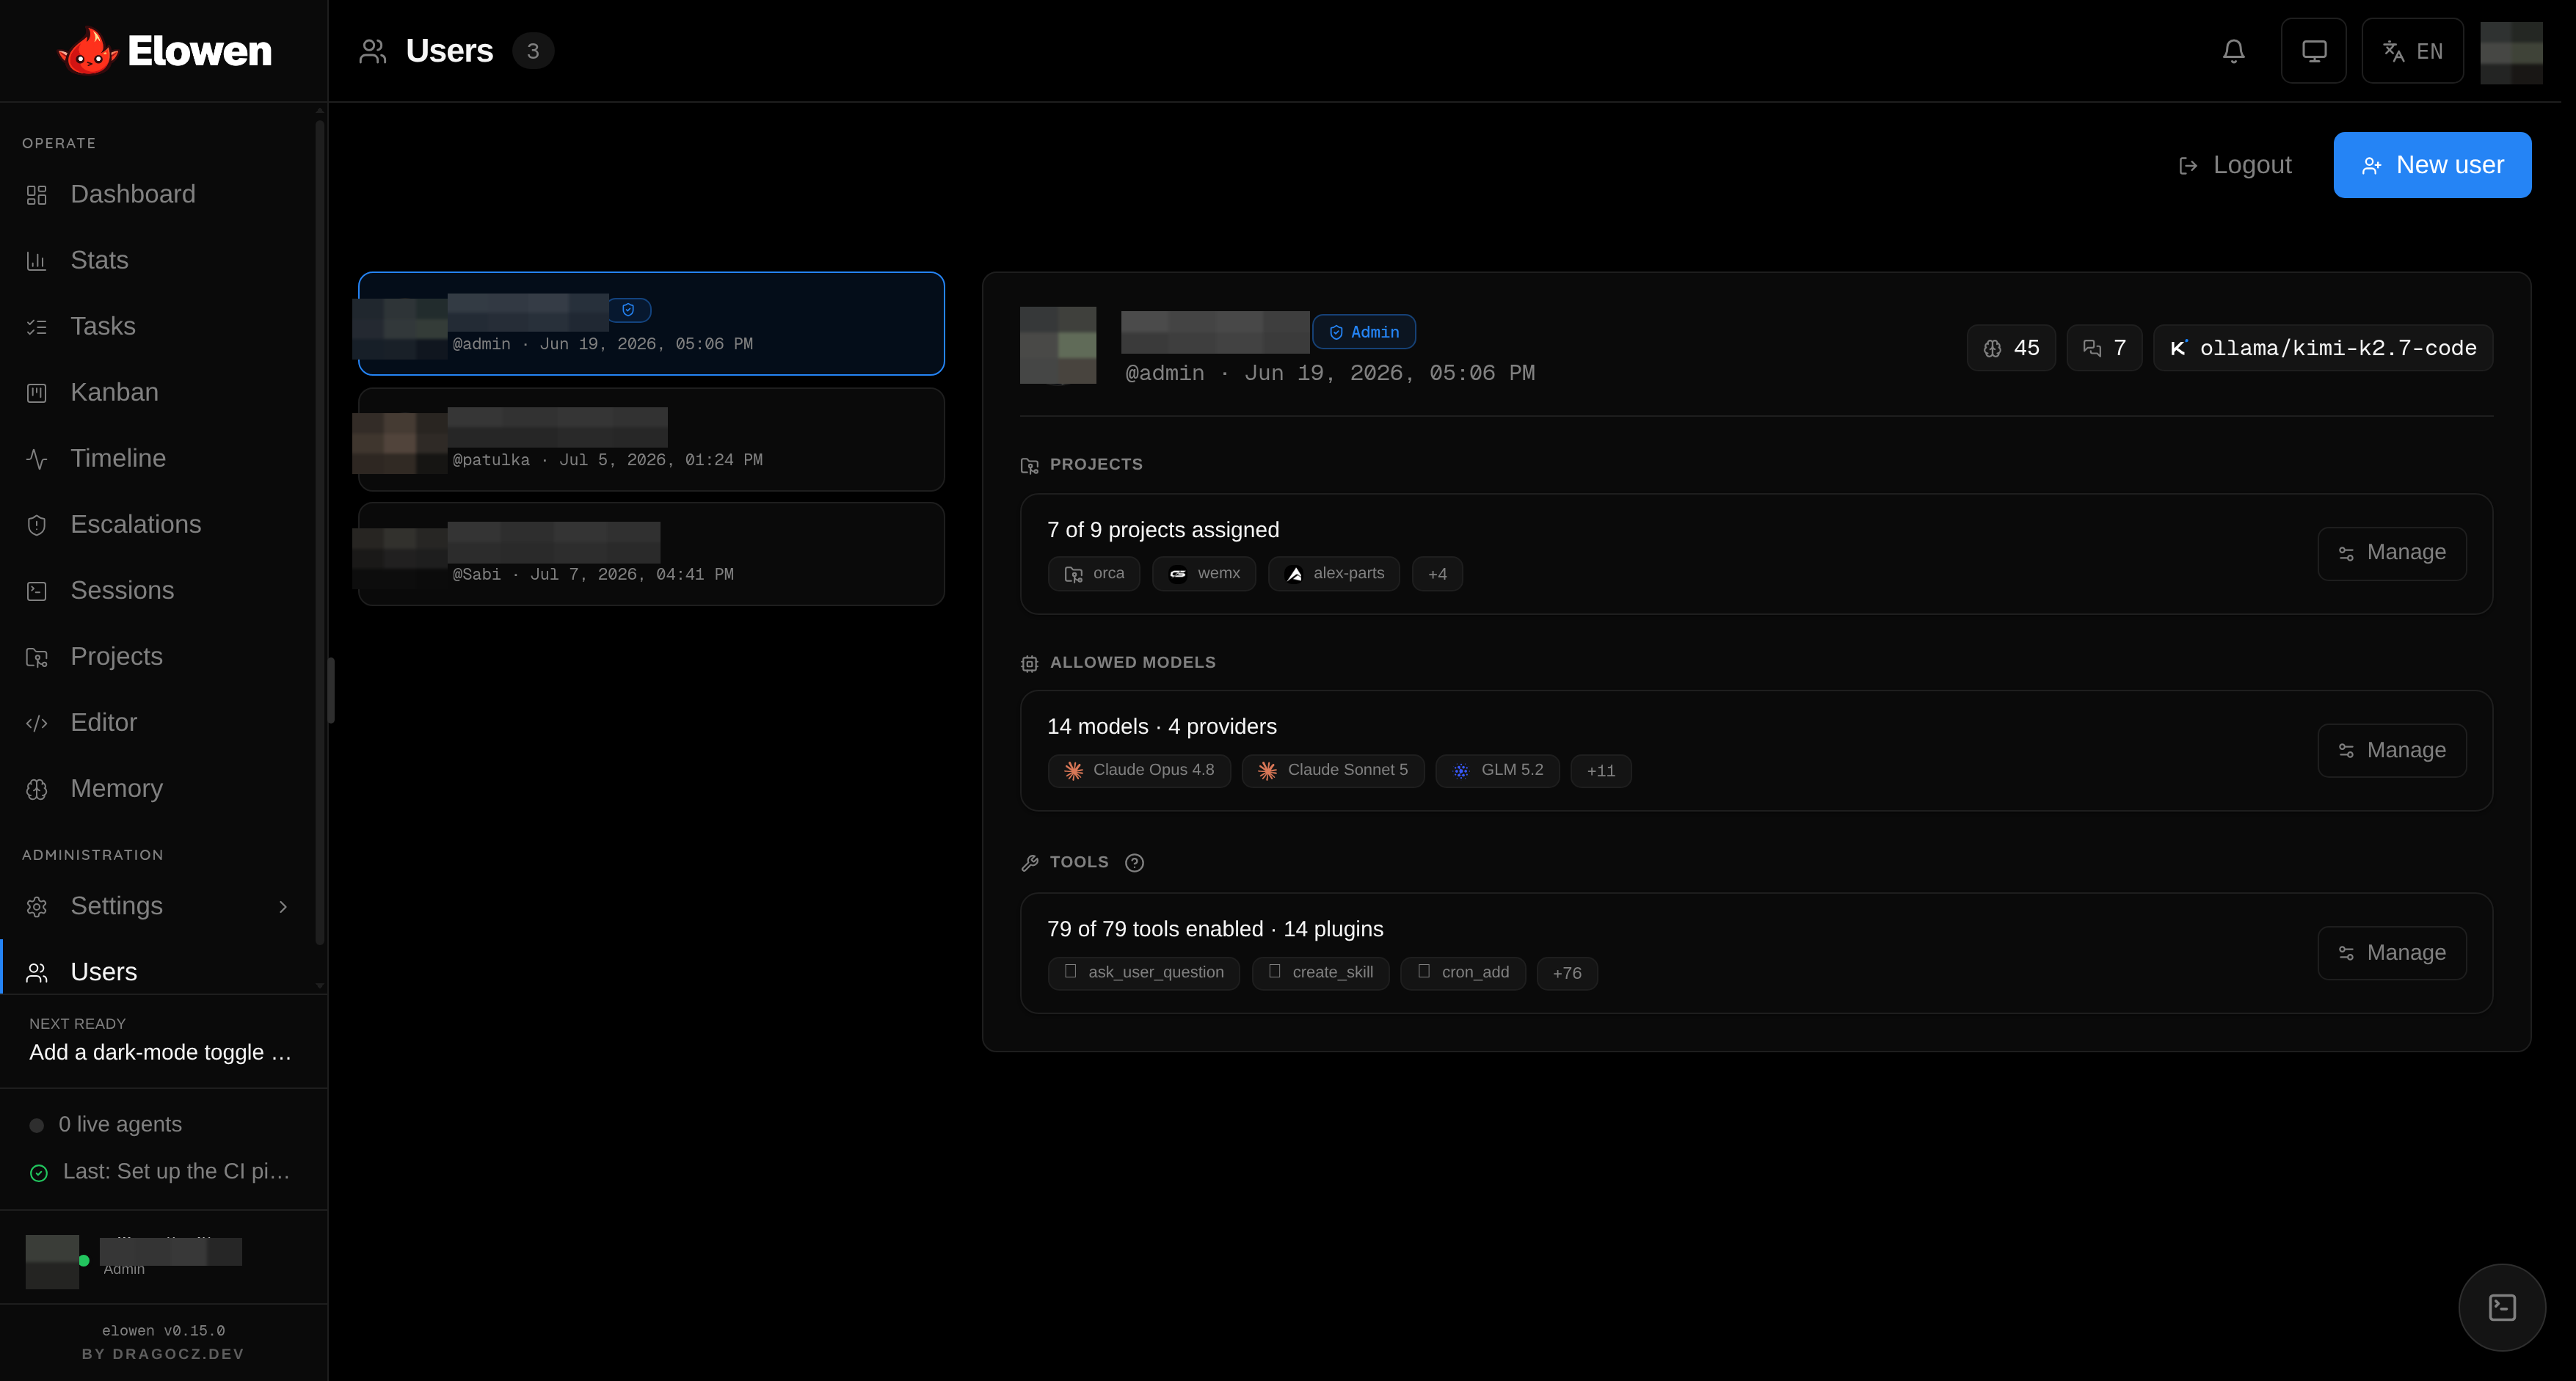
Users have roles, project assignments, allowed models, and per-user tool controls. The UI shows these as an effective-access summary, while the daemon enforces them at execution time. An administrator can inspect another user's context only through the dedicated user-management controls; ordinary users see their own permitted data.
For the security model and account-level choices, see Users & Access.